Several forces are shaping today’s markets. Interest rates have climbed to their highest levels in 20 years, while strong corporate earnings continue to support stock prices. Along the way, oil prices rose above $100 per barrel, the Federal Reserve raised its key interest rate for the first time in three years, and questions around artificial intelligence (AI) grew as November’s midterm election draws closer.
Despite all this, major U.S. stock market indexes are near record highs, and the gains have been spread across many parts of the market. The energy sector, international stocks, and commodities (raw materials like oil and metals) all helped portfolios. As we look ahead staying diversified remains an important strategy.
Higher interest rates are reshaping the investment landscape
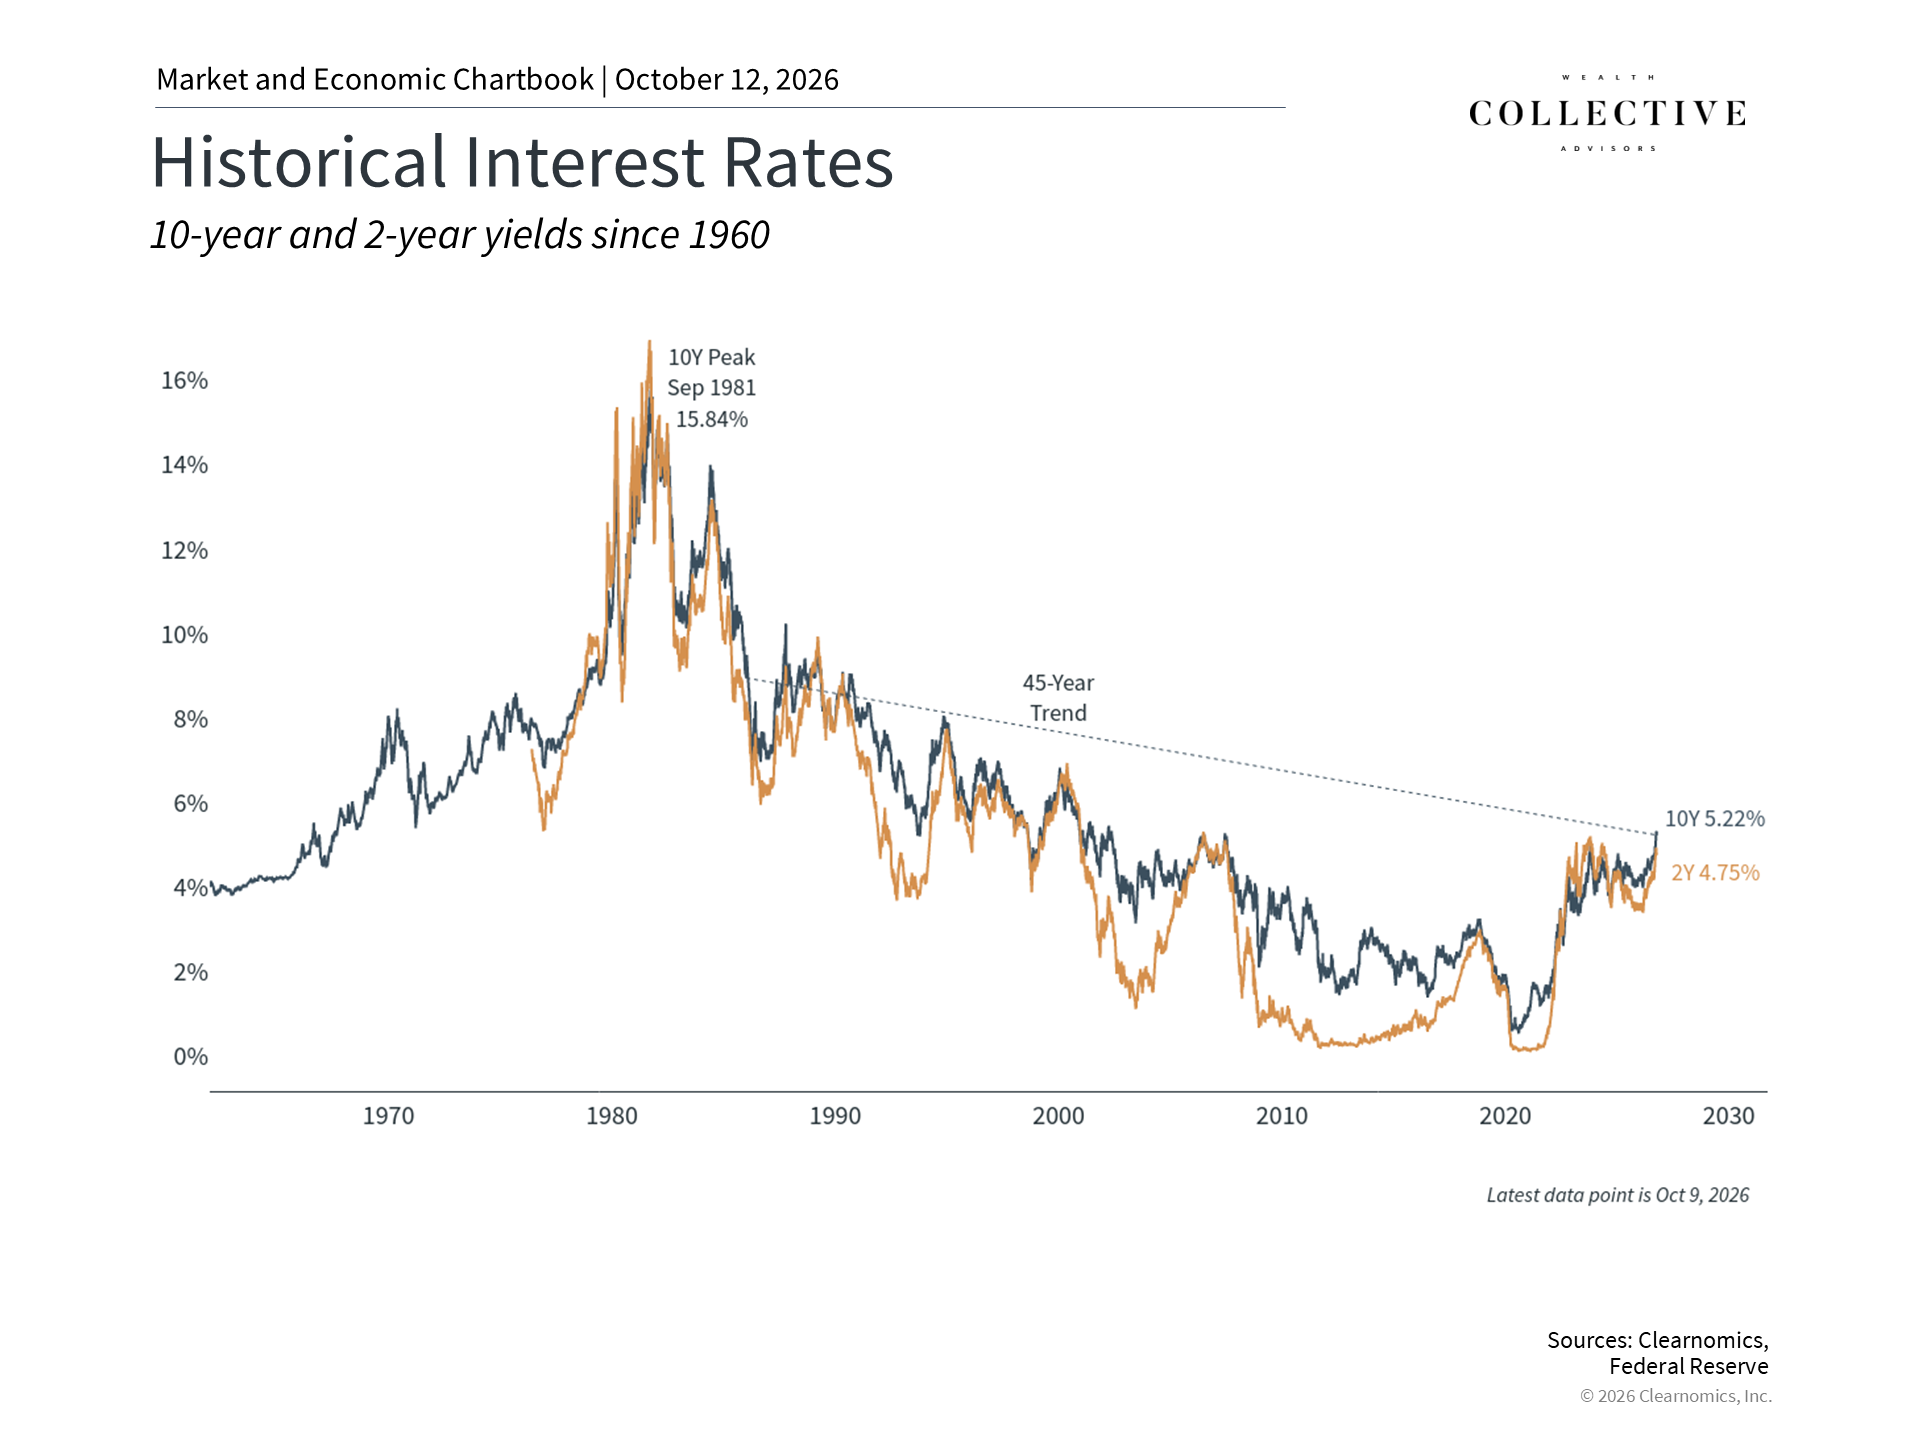
The markets biggest story is rising interest rates, which reached levels not seen since the early 2000s. When interest rates are higher, bonds pay more income. This makes bonds more appealing than they were during the long period of very low rates that followed the 2008 financial crisis.
From the early 1980s to 2020, interest rates gradually fell over roughly 40 years. This was a favorable period for bonds, since falling rates increase the value of existing bonds.2 Higher rates today also affect everyday finances. For example, according to Freddie Mac, the average 30-year fixed mortgage rate has risen above 7%, making it more expensive to buy a home.3
Strong earnings and AI spending are lifting markets broadly
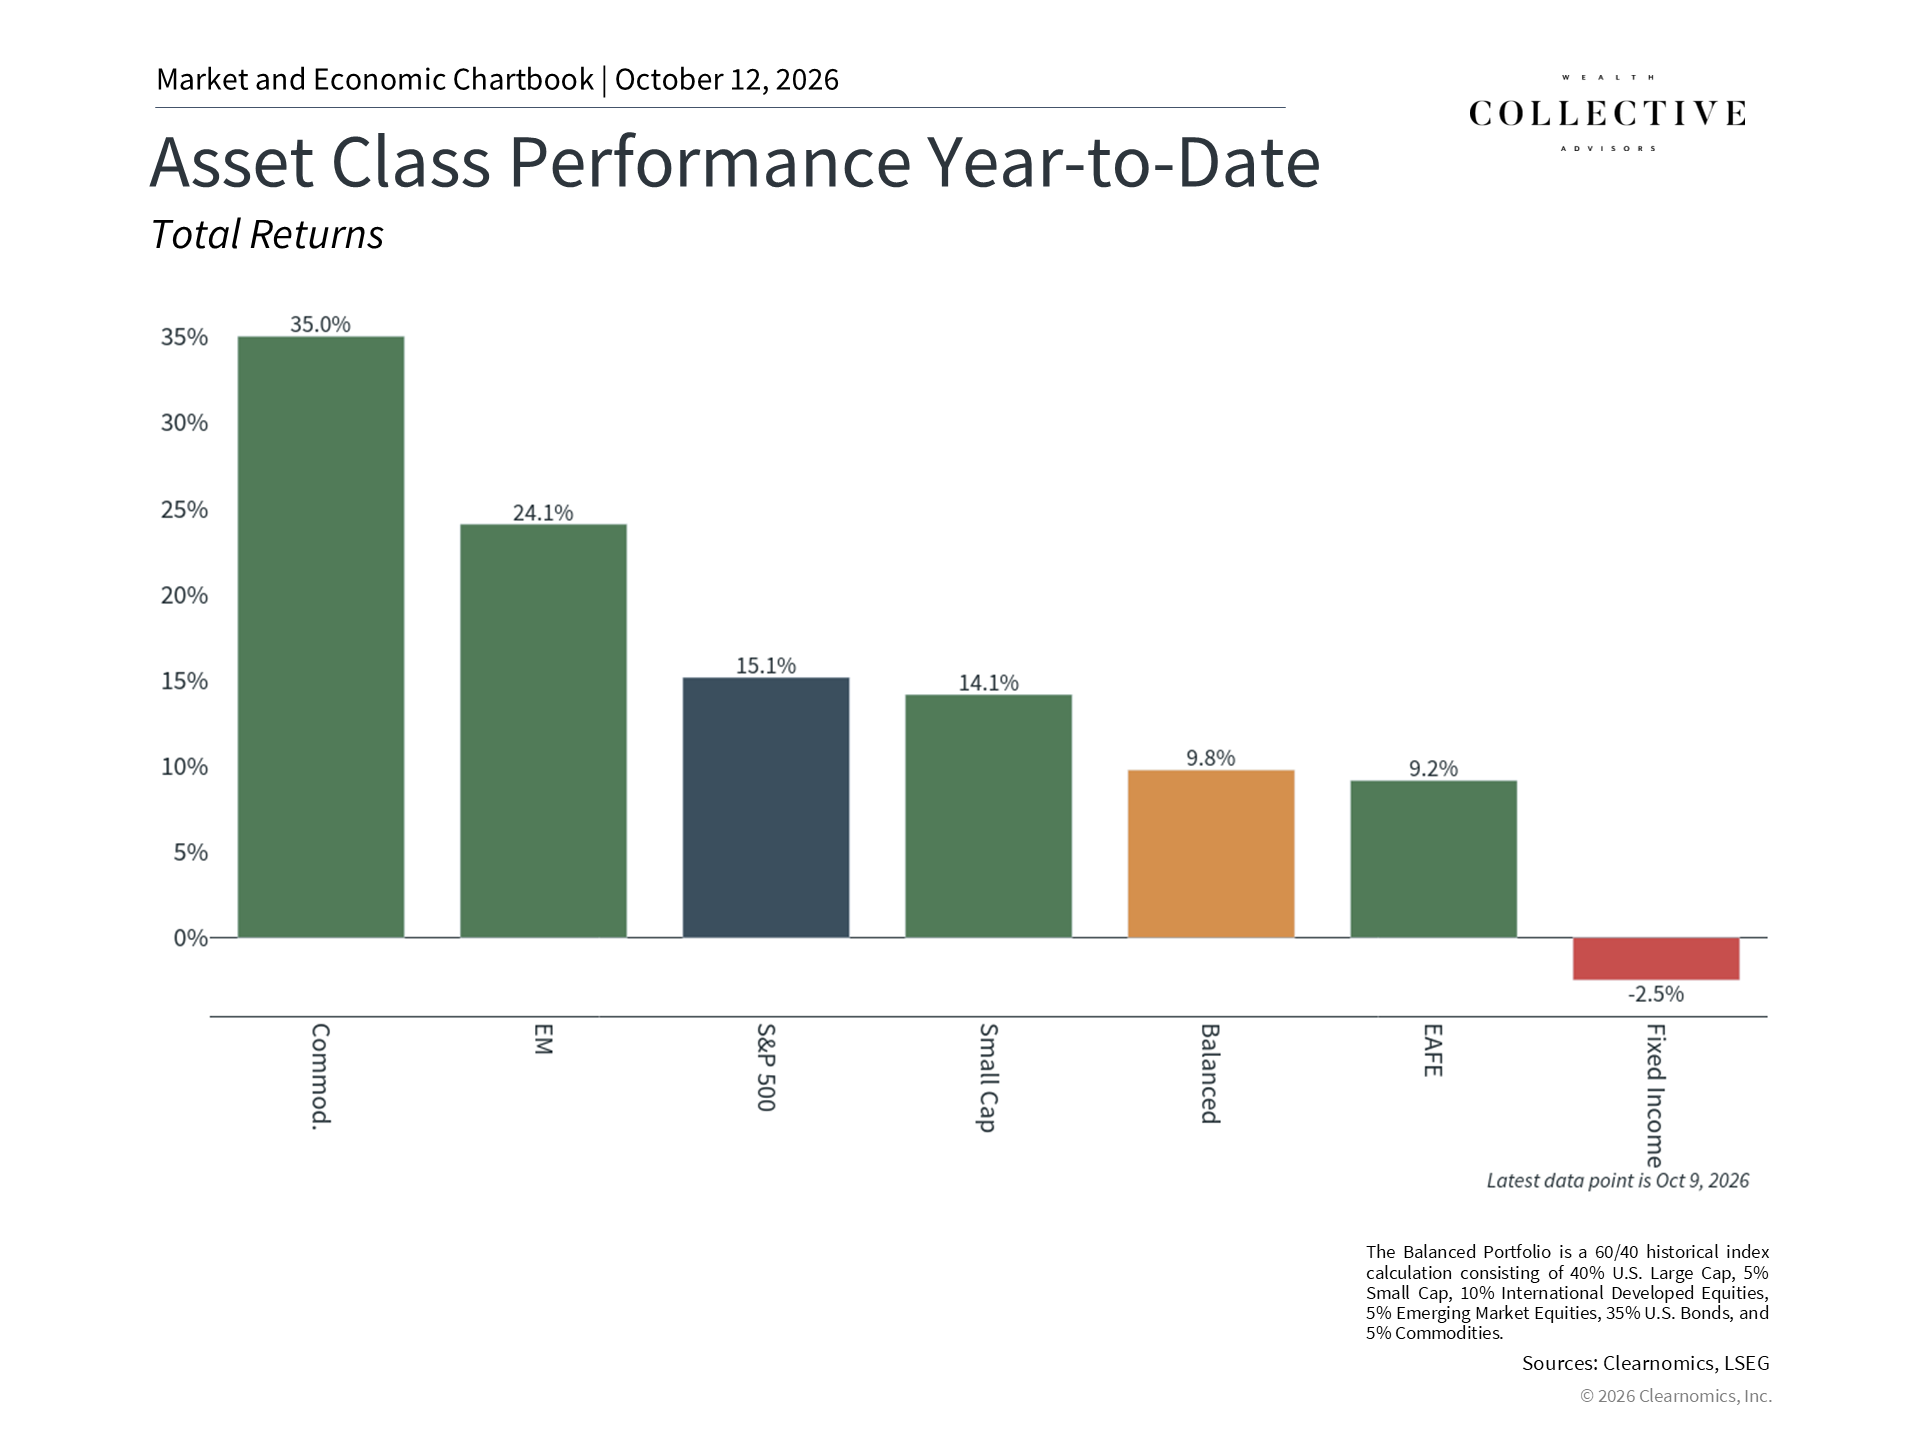
Despite short-term ups and downs, major U.S. stock indexes reached new all-time highs in the third quarter. A strong economy and heavy investment in AI technology helped boost corporate profits. Current estimates suggest that S&P 500 earnings could grow by more than 30% across 2026.4
Positive performance extended beyond just large U.S. companies. Smaller companies and international markets, particularly semiconductor (computer chip) companies in Asia, also benefited from AI-related investment.5 Commodities rose sharply as well, with oil prices climbing from around $70 per barrel in early July to over $100 in September due to ongoing conflict in the Middle East. The fact that many different asset types contributed to returns highlights the value of holding a well-diversified portfolio.
The Fed raised rates for the first time in three years
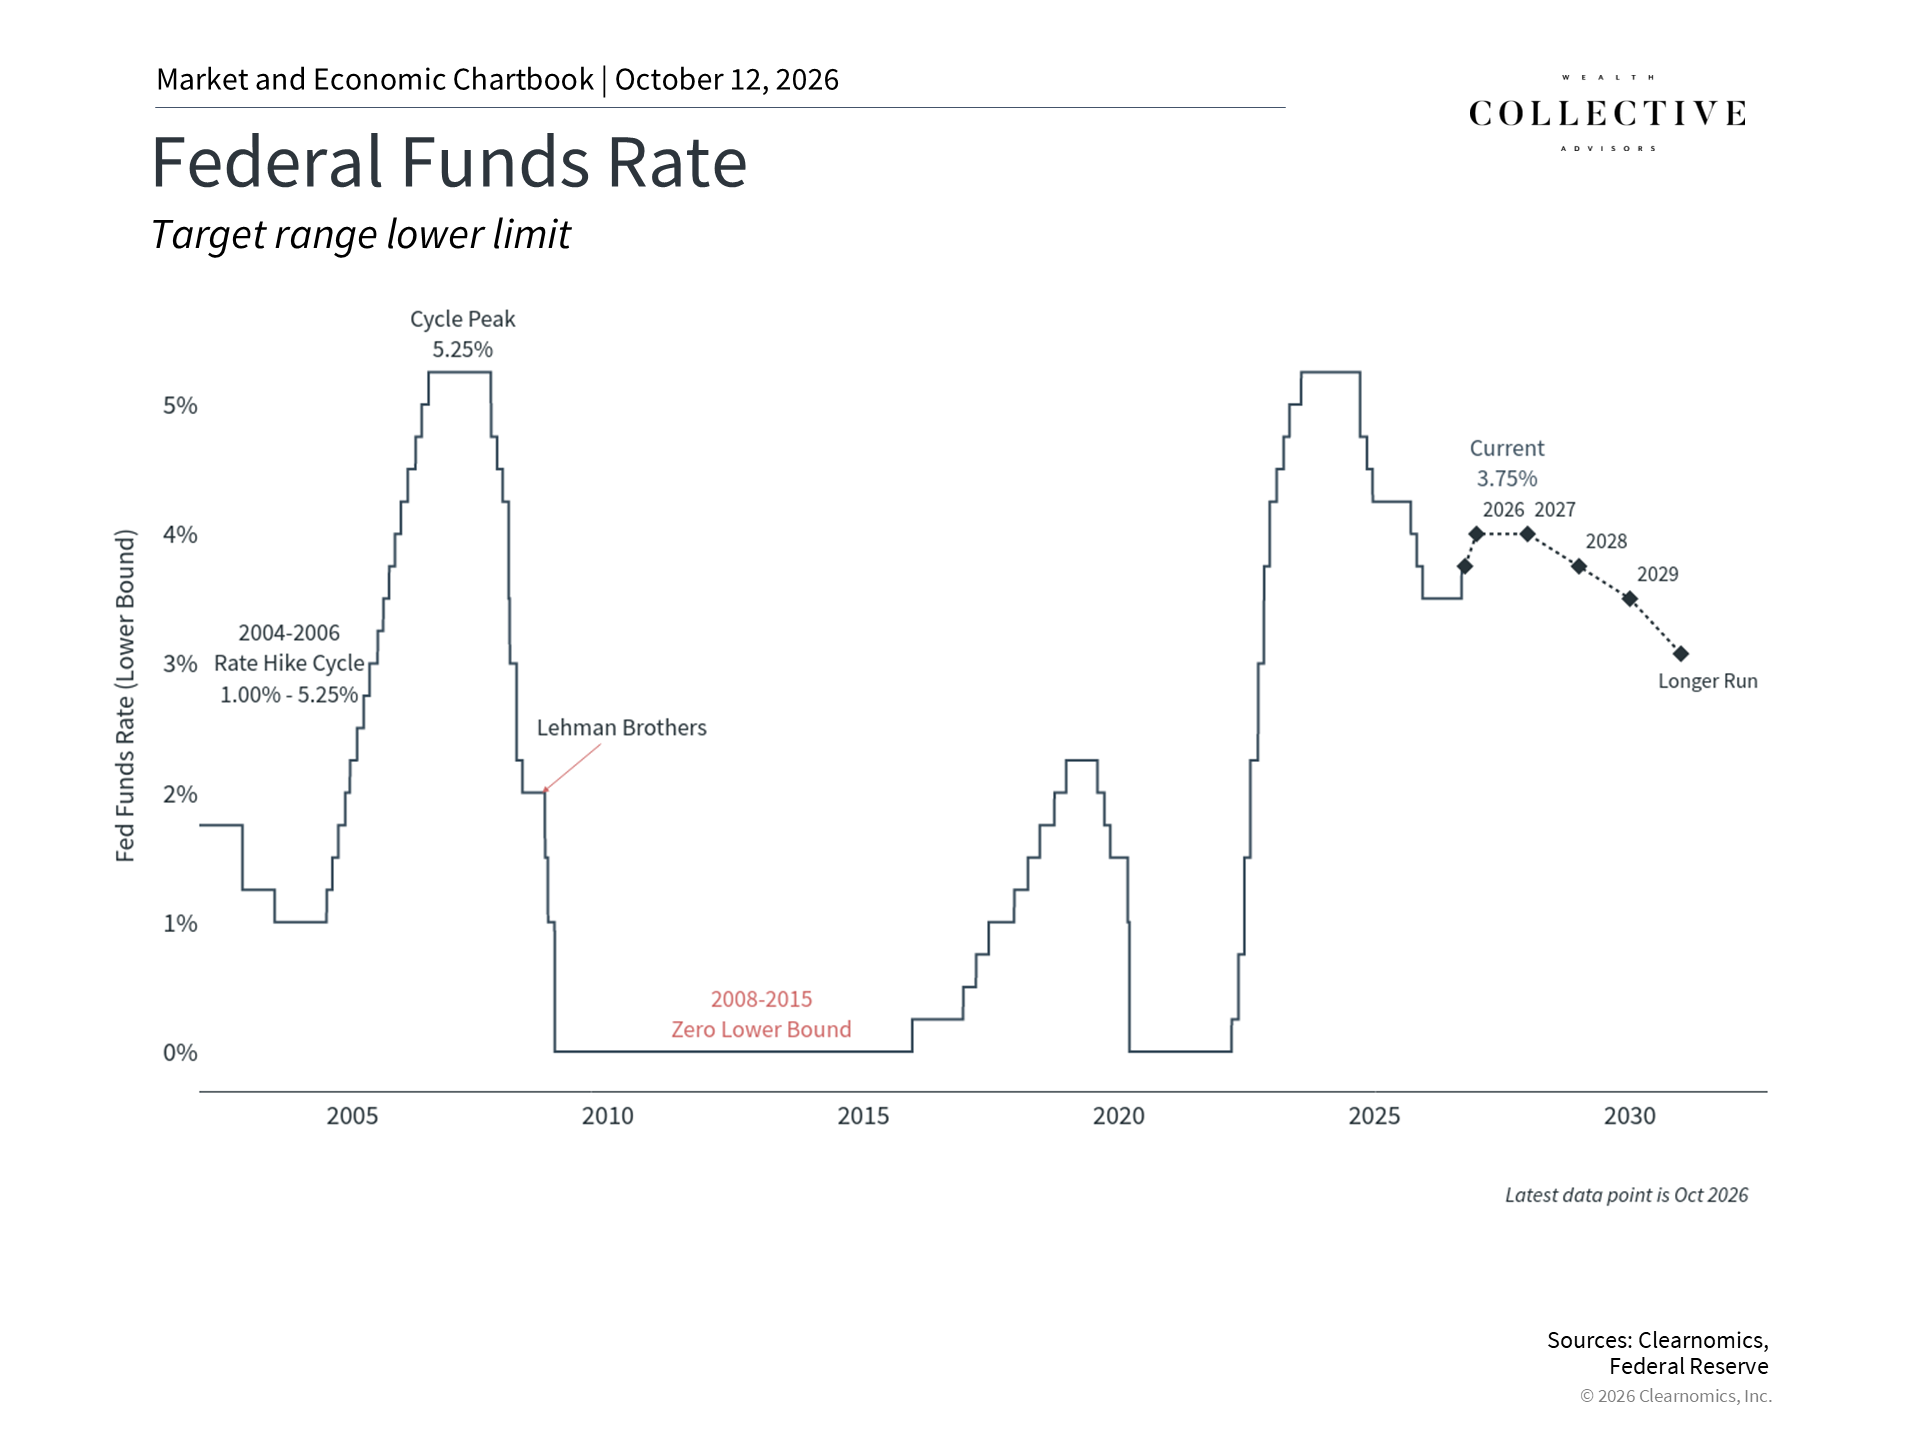
In September, the Fed raised its key interest rate by one-quarter of a percent, to a range of 3.75% to 4.00%. This was the first rate increase in three years, coming after a series of rate cuts from September 2024 to December 2025.6 The move was widely expected by investors, so markets absorbed the news without major disruption.
The Fed raised rates mainly in response to higher energy prices, a situation economists call “cost-push inflation,” where supply disruptions push prices up. Fed officials currently project one more rate increase this year, followed by a pause through 2027. It is worth noting that higher rates do not automatically hurt stocks. Historically, markets and rates have sometimes risen together when the economy and corporate earnings are strong, as seen this past quarter.
Upcoming midterm elections and what they mean for investors
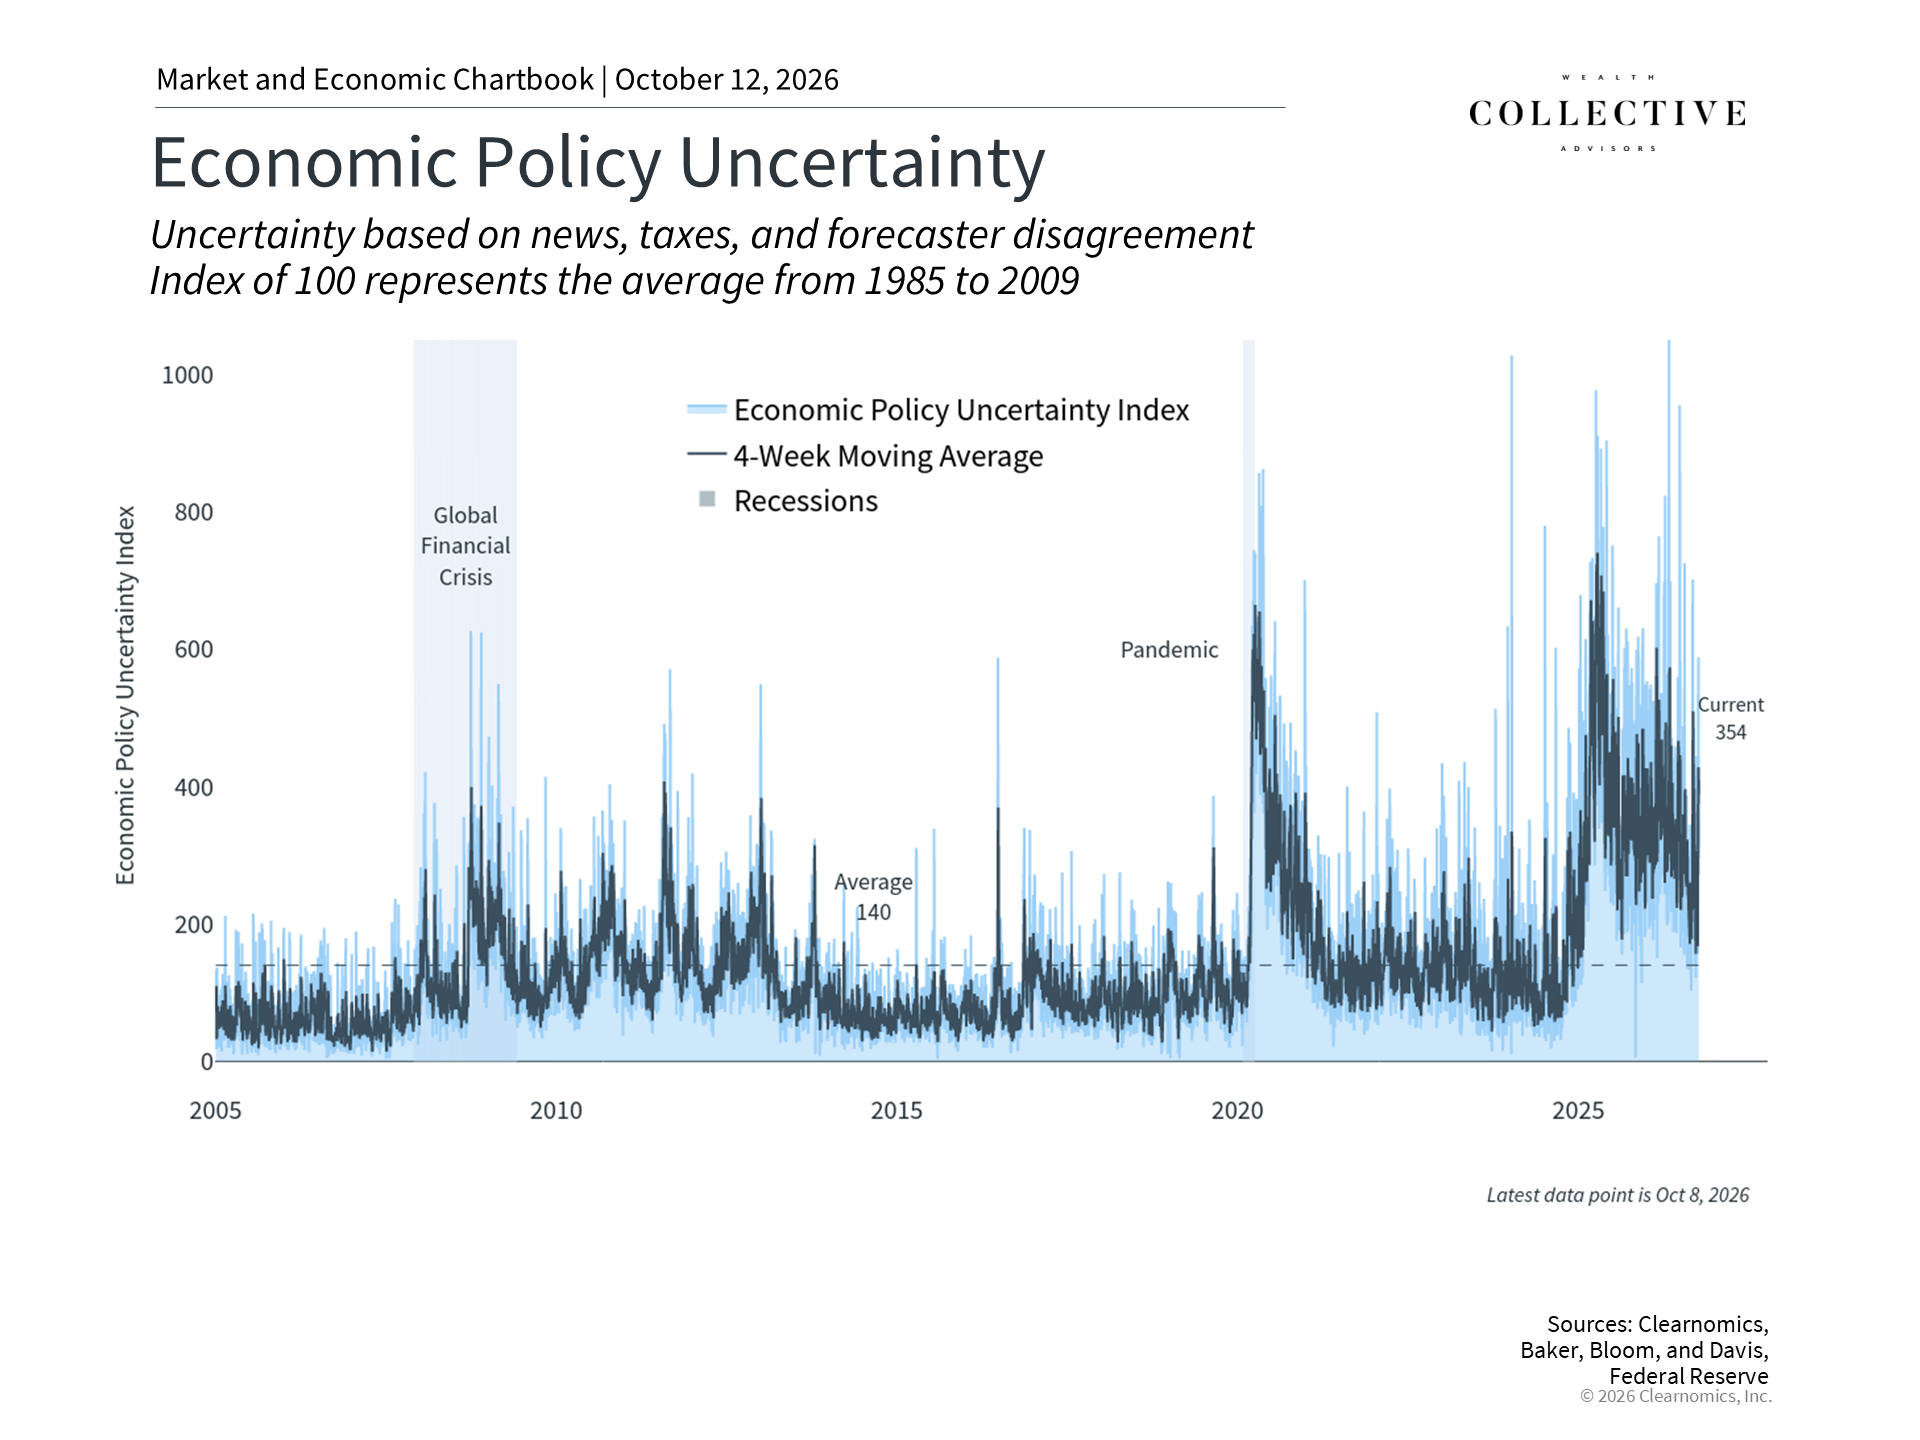
Elections matter greatly as a reflection of public values and a driver of policy. However, it is generally wise for investors to avoid making big portfolio changes based on election outcomes. History shows that the S&P 500 has averaged annual total returns of 8.6% in midterm election years since 1933, and markets have generally performed well under many different political configurations.7 It is also quite common for the sitting president’s party to lose its Congressional majority in midterm elections, as happened under Biden, Trump’s first term, Obama, and Clinton, among others.8
Another concern for some investors is the national debt, which recently exceeded $40 trillion for the first time, or about $120,000 per American.9 The annual budget deficit is projected to be above $2 trillion for the government’s 2026 fiscal year.10 Over time, a rising national debt could increase government borrowing costs. Still, a portfolio built to perform across a range of conditions is more reliable than one built around the outcome of any single election.
AI’s influence on sectors and long-term productivity
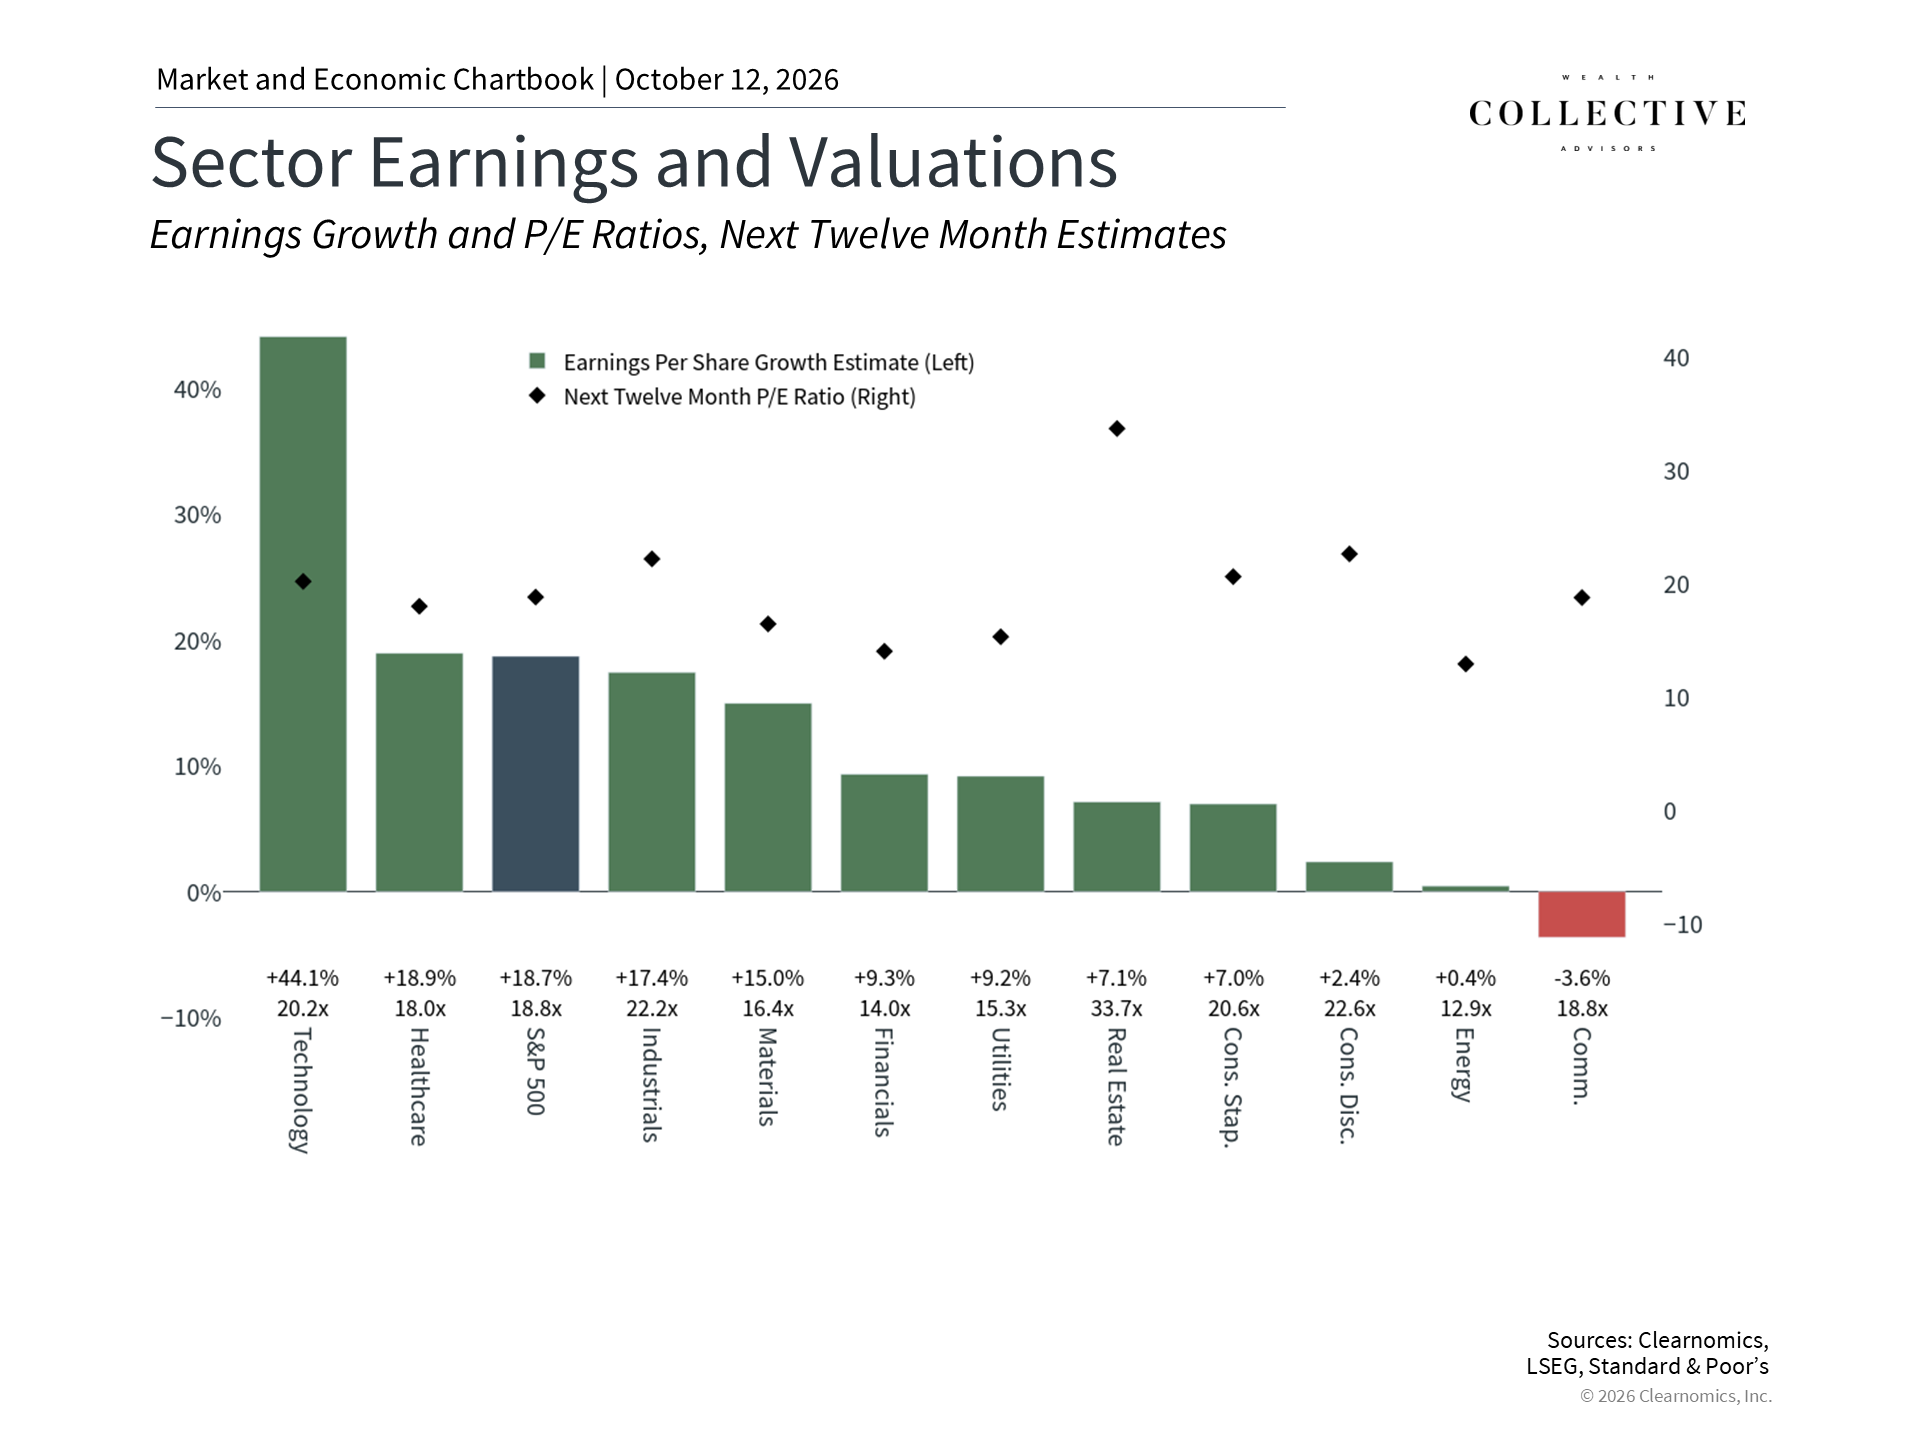
AI has been one of the biggest drivers of stock market performance in recent years. It has not only lifted a small group of very large technology companies, such as the Magnificent 7, but has also boosted earnings more broadly across sectors. The Information Technology sector has seen notably stronger earnings growth compared to the other ten S&P 500 sectors.11 Some investors worry about “concentration risk,” meaning the market being too dependent on just a few big companies. However, other sectors have also delivered strong returns. The energy sector, for example, is the top performer year-to-date with a gain of 37.4% through the third quarter.
A key question going forward is whether AI will lead to lasting gains in productivity, meaning whether it will help workers and companies get more done efficiently. The 2020s have so far seen average productivity growth of 2.1% per year, up from 1.2% in the 2010s. Whether AI can sustain or improve on this will be an important factor for markets and the economy in the years ahead.
The bottom line? Maintaining a long-term perspective, rather than reacting to short-term headlines, remains the most constructive approach for investors navigating these trends. As new developments unfold and the midterm election approaches, investors should continue to stay balanced and focus on financial goals.
References
- Return figures represent total returns with reinvested dividends. All figures as of September 30, 2026
- Clearnomics research using Federal Reserve data, as of September 30, 2026
- https://www.freddiemac.com/pmms
- Clearnomics research using LSEG data, as of September 30, 2026
- Clearnomics research using FTSE Russell and MSCI data, as of September 30, 2026
- https://www.cmegroup.com/markets/interest-rates/cme-fedwatch-tool.html
- Clearnomics research using Standard & Poor’s data, as of September 30, 2026
- Clearnomics research using Standard & Poor’s data, as of September 30, 2026
- https://fiscaldata.treasury.gov/americas-finance-guide/national-debt/
- Clearnomics research using LSEG and Standard & Poor’s data, as of September 30, 2026
- https://fiscaldata.treasury.gov/americas-finance-guide/national-deficit/https://fiscaldata.treasury.gov/americas-finance-guide/national-debt/
Advisory services are offered through Collective Wealth Advisors LLC, a Registered Investment Adviser with the SEC. For informational and educational purposes only and should not be construed as specific investment, accounting, legal, or tax advice. Certain information is based upon third party data which may become outdated or otherwise superseded without notice. Third party information is deemed to be reliable, but its accuracy and completeness cannot be guaranteed. Neither the Securities and Exchange Commission (SEC) nor any other federal or state agency have ap- proved, determined the accuracy, or confirmed the adequacy of this article.